Score Submission
One team, typically the winning one, is required to submit the scorecard after each round-robin game, detailing each end. All submitted scorecards can be found on this site — click on a team name in the Standings to view their scorecard. Teams earn points not only for winning but also for each end won, every rock scored, and more.
For playoff games, scan the QR code for your sheet of ice and game time, then select the winning team’s name on your phone. The bracket will update automatically. If a result needs to be corrected, please notify a tournament supervisor.
Ranking
Teams’ cumulative point totals after the round-robin will determine their rank. In case of a tie in standings, a tiebreaker will be used (see the tiebreaker section here).
NEW FOR 2026: Lower Division teams earn half points for the same in-game outcomes, which naturally seeds them into the lower playoff brackets. See the Divisions FAQ for more information.
Round Robin Score Entry
In the Round Robin tournament, teams accumulate points through various means, not just by winning. Points are also awarded for each end won, every rock scored, and more.
These points play a crucial role in determining the playoff bracket your team will be seeded into. After playing three round-robin games, your team’s total points are compared with all other teams. Teams are then ranked according to their point totals.
Here’s the breakdown of how points are awarded:
- Win: 8 points
- Tie: 4 points
- Loss: 2 points
- Scoring Rock: 0.5 points each (up to a maximum of 6 points)
- Stolen End: 0.25 points each
- End Won: 2 points (1 point for a blanked end)
- Concession: Up to 2.75 points for each end remaining
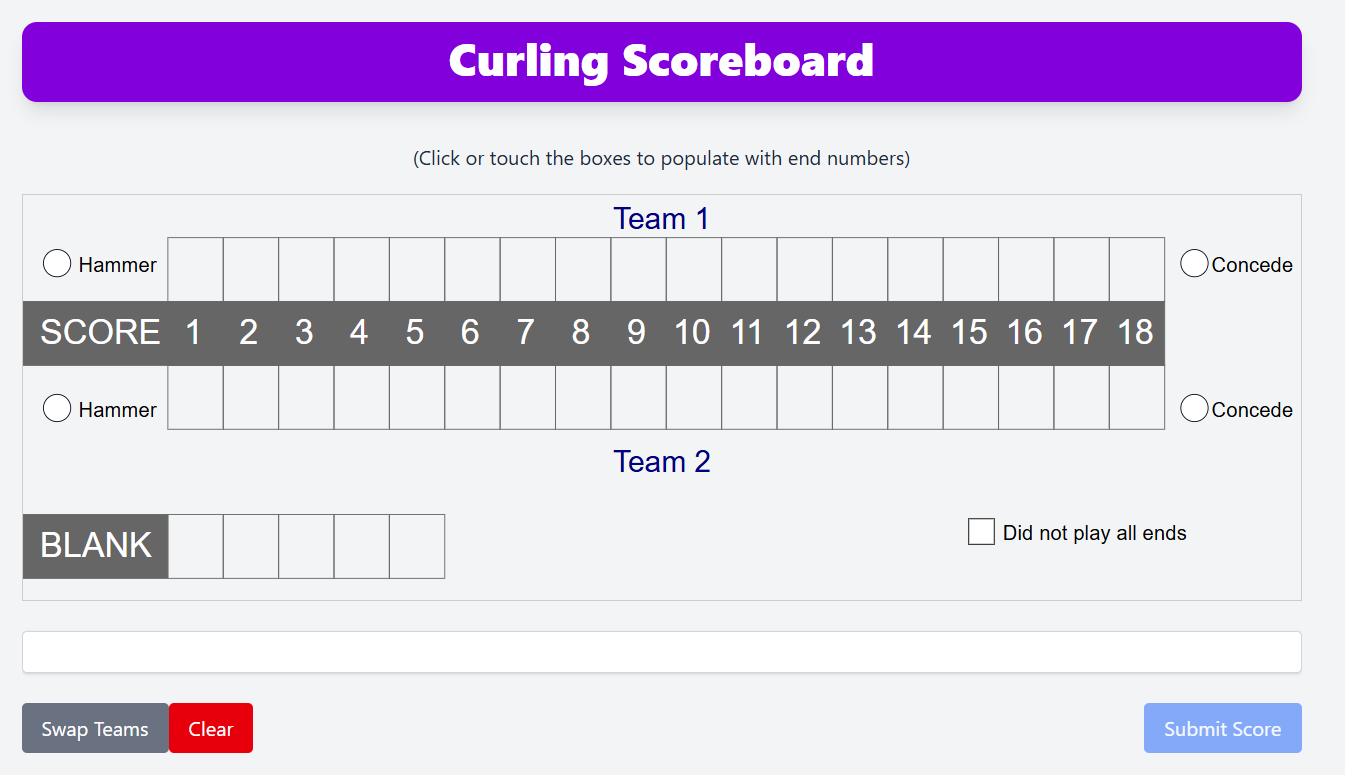
To enter scores, scan the QR code on the scorecard at your sheet of ice. This will open the digital scoreboard on your phone. For best results, turn your phone sideways to landscape mode.
Be sure to record who had the hammer (last rock advantage) in the first end, and enter the result of each end.
Once submitted, scores cannot be changed by teams. If you’ve made an error, please notify a tournament supervisor who can correct it through the admin system.
A screenshot of the score entry system is below.
Statistical Analysis of Points / Standings
Based on the data generated from 500 random 84-game simulations, the following table presents the statistics for the point ranges that may qualify your team for a specific playoff division. The statistics include the minimum (Min), maximum (Max), mean, and standard deviation (StdDev) of the simulated points.
| Division | Min | Max | Mean | StdDev |
|---|---|---|---|---|
| A Event | 42.50 | 77.50 | 53.22 | 5.12 |
| B Event | 36.00 | 52.50 | 43.45 | 2.71 |
| C Event | 28.75 | 45.25 | 35.99 | 2.46 |
| D Event | 23.25 | 36.50 | 29.01 | 2.46 |
| E Event | 19.12 | 30.25 | 23.59 | 1.59 |
| F Event | 14.25 | 24.36 | 19.42 | 1.55 |
| G Event | 4.50 | 20.25 | 13.95 | 2.65 |
Please note that these are estimates and actual results may vary.